| Hilde Fagerli | head of EMEP MSC-W | h.fagerli (@) met.no |
| Michael Schulz | aerosols, acid deposition, radiative forcing | michael.schulz (@) met.no |
| Jan Eiof Jonson | photochemical oxidants, acid deposition, heteorogenous cloud chemistry | j.e.jonson (@) met.no |
| David Simpson | photochemical oxidants, SOA, biosphere-atmosphere exchange | d.simpson (@) met.no |
| Svetlana Tsyro | particulate matter, aerosol dynamics, pm emissions, satelite | s.tsyro (@) met.no |
| Anna Carlin Benedictow | meteorology, chemical forecasting | a.benedictow (@) met.no |
| Peter Wind | numerical methods, projections, local and global modelling | p.wind (@) met.no |
| Per Helmer Skaali | administrative tasks, economy | p.h.skaali (@) met.no |
| Michael Gauss | global and local modelling | m.gauss (@) met.no |
| Agnes Nyiri | emissions, SR calculations | a.nyiri (@) met.no |
| Alvaro Valdebenito | data assimilation, chemical forecasting, satellite | a.valdebenito (@) met.no |
| Augustin Mortier | data visualisation | augustm (@) met.no |
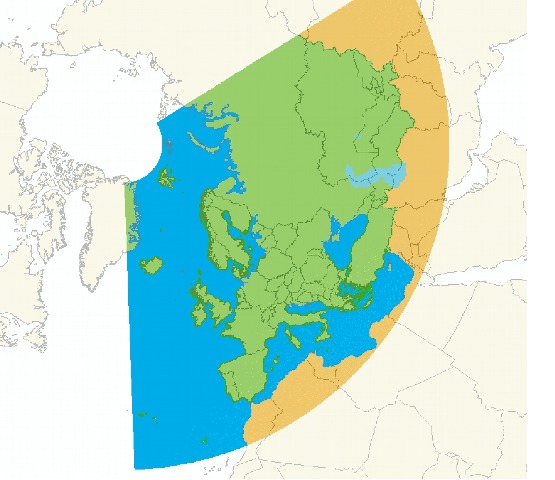
The MSC-W has been hosted by the Norwegian Meteorological Institute since the beginning of the EMEP programme in 1979. The main task of the centre is to model transboundary fluxes of acidifying and eutrophying air pollution, photochemical oxidants and particulate matter. A key product of the MSC-W modelling work within EMEP is the source-receptor matrices or the so-called "blame-matrices" which estimate the contribution of the emissions in any country to the depositions or air concentrations of main pollutants, ground level ozone and PM in any other country.
The chemical transport model developed at Meteorological Synthesizing Centre - West (MSC-W) is called the EMEP MSC-W model. The model was released as OpenSource code in 2008 and is under continous development for meeting new tasks within the EMEP programme and other projects.
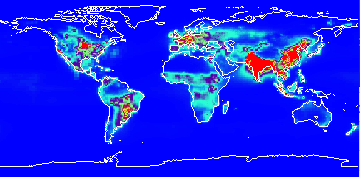
Acidifying and eutrophying pollutants originate primarily from anthropogenic emissions of sulphur dioxide (SO2), nitrogen oxides (NOx) and ammonia (NH3 ). Most of SO2 and NOx is emitted to the atmosphere under the combustion of fossil fuel in electricity generating power stations, industrial plants, residential heating, commercial and service sectors. Road transport, shipping and aircraft are significant sources of NOx emissions. NH3 emissions are related to agricultural activities such as storage of manure, soil fertilising, animal husbandry, etc.
When emitted to the atmosphere, acidifying and eutrophying pollutants may remain in air for several days and therefore, be dispersed and carried over long distances by winds. They can be transported across national boundaries and cause damaging effects far from the source of emission. Acidifying pollutants are removed from the atmosphere by wet ("acid rain") or dry (direct uptake by vegetation and surfaces) deposition.
Effects of acid deposition are widespread and appear in a number of ways, including e.g. acidification of freshwater systems resulting in the loss of fisheries, impoverishment of soils, damage to forests and vegetation, corrosion of buildings, cultural monuments and materials. The man-made gaseous sulphur and nitrogen emissions are precursors to the formation of small particles (PM2.5) which impact human health. Deposition of nitrogen-containing compounds also contributes to the eutrophication ("excess nutrient enrichment") of terrestrial and marine ecosystems. Their eutrophying effect is associated with increased leaching of nitrogen to ground water, streams and lakes and changes in the forest ecosystems leading to vegetation changes favouring nitrogen-tolerant species.
Contact persons: hilde.fagerli(@)met.no and svetlana.tsyro(@)met.no
Contact persons: jan.eiof.jonson(@)met.no and david.simpson(@)met.no
The impact on human health by atmospheric particles was the recognized driving force for the extension of EMEP framework to include particulate matter (PM) in 1999. The preliminary assessment by WHO-EMEP (1999) specifically highlighted that PM from long range transport contribute significantly to these effects.
The later review of evidence on health aspects of particulate matter - REVIHAAP (WHO, 2013) – based observed at levels commonly present in Europe, indicates that the effects in some cases occur at air pollution concentrations lower than those serving to establish the previous WHO air quality guidelines, last updated in 2005. Epidemiological and toxicological studies based of PM 2.5 and PM 10 mass concentrations comprises show varying types and degrees of health effects, suggesting a role for both the chemical composition (black carbon, secondary organic and secondary inorganic aerosols) and physical properties (size, particle number and surface area). Furthermore, the new evidence suggests that short-term exposures to coarse particles (including crustal material) are associated with adverse respiratory and cardiovascular effects on health, including premature mortality; and toxicological studies report that coarse particles can be as toxic as PM 2.5 on a mass basis (though data from clinical studies are scarce). A variety of air pollution anthropogenic sources have been associated with different types of health effects (e.g. carbonaceous particles from traffic, traffic-generated dust; residential and industrial combustion, metal industries, shipping etc.), but also desert dust episodes have been linked with cardiovascular hospital admissions and mortality in a number of recent epidemiological studies. In addition to health effects, aerosols are also short-lived climate pollutants, strongly contributing to climate change.
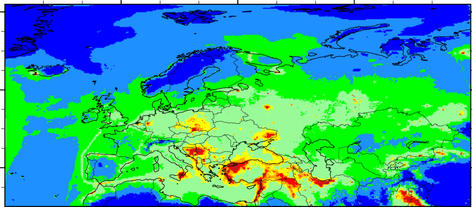
The EMEP MSC-W model accounts for particulate pollution from anthropogenic sources based on officially submitted to EMEP emissions of primary PM and gaseous precursors and that of natural origin (i.e. from sea spray, windblown dust, biogenic VOCs, forest fires). The model provides annual assessments of European background levels of PM 10 and PM 2.5 and exceedances of EU critical levels and WHO Air Quality Guidelines, as well as concentrations of the individual aerosol components (SO42-, NO3- and NH4+, organic and elemental carbon, sea salt and mineral dust). Model results for PM 10 and PM 2.5 and their chemical composition are regularly evaluated against observations from EMEP monitoring and intensive measurement periods, and lately also with observations from European Environment Agency’s Air Quality e-Reporting data base. Source-receptor matrices (SRMs) are annually calculated for PM 2.5 and PM 10 for EMEP countries and sea areas. Recently, the countries have started submitting emissions of Black Carbon (BC), so that SRMs are also produced for fine and coarse elemental carbon.
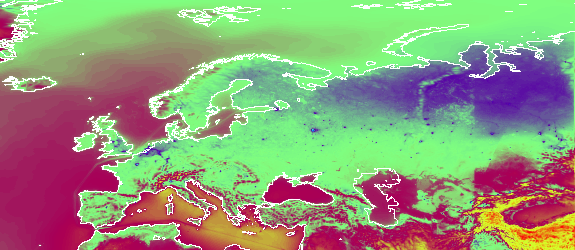
Finally, the EMEP MSC-W model calculates aerosol extinction and aerosol optical depth (AOD) and allows deriving aerosol backscatter and absorption, which facilitates model evaluation with remote sensing measurements, e.g. AOD observations from AERONET sun- photometers and satellites and aerosol extinction profiles from EARLINET lidars and satellites.
Contact person: svetlana.tsyro(@)met.no
Contact: emep.emissions@umweltbundesamt.at
Contact person: anne-gunn.hjellbrekke(@)nilu.no
Contact: emep.mscw@met.no
The chemical transport models developed at Meteorological Synthesizing Centre -
West (MSC-W) are concerned with the regional atmospheric dispersion and
deposition of acidifying and eutrophying compounds (S, N), ground level ozone (O3)
and particulate matter (PM2.5, PM10).
Until 1998, 2-D Lagrangian Acid Deposition model was routinely used at EMEP/MSC-W.
In 1989, the MSC-W of EMEP began the work on the development of an ozone model
of adressing both the problem of short-term episodic ozone and long-term (growing
season) ozone. The model was called in the beginning the Lagrangian Ozone model
and is also known as the Lagrangian Photooxidant model.
The EMEP Lagrangian model was not explicitly designed to model particulate
matter, but it calculated air concentrations of four secondary particles:
sulphate, nitrate, ammonium sulphate and ammonium nitrate.
In 1997 results from the EMEP Eulerian photooxidant model were presented for the
first time. In 1999 3-D Eulerian Acid Deposition Model was applied
to calculate air concentration and deposition fields for major acidifying and
eutrophying pollutants as well as their long-range transport and fluxes across
national boundaries.
In 2002, the Unified EMEP model, was introduced; A modelling system that
unified the acidifying and the oxidant versions of the eulerian model.
The Unified EMEP model code (version rv3) was released as open source under the
GPL license v3 in February 2008. The release of the code included also a full
input data set for 2005 and model results for comparison.
The latest EMEP/MSC-W model Open Source code with the most recent input data
and model results for comparison is updated every year.
with model updates/developments described in latest EMEP Status Reports (since 2013) |
During the development of the models the grid resolution has changed and the
description of the EMEP grid both for Lagrangian model (150x150 km2) and the Eulerian model (50x50 km2) is found here in addition to latest model grids:
Powered by w3.css